When writing formulae in a default installation of Excel, RAND() is the only function from which randomness can be directly derived. According to the documentation, RAND() generates an “evenly distributed random number greater than or equal to 0 and less than 1â€. Installation of the Analysis ToolPak also makes the RANDBETWEEN() function available for use, which takes two integers as arguments and, again according to the documentation, returns a “random integer number between the numbers you specify”.
Note that in the case of RAND(), I say derived directly, because it’s also technically possible to use the old Microsoft-endorsed trick of using the sixth decimal place onwards from the NOW() function and multiplying up to the range 0–1. (However, for a given calculation cycle the NOW() technique returns the same random value for every cell in the spreadsheet making use of it, so it’s not always desirable.) Rounding out Excel’s random number generation capabilities are two additional methods, which are slightly more cumbersome but have the key property of allowing a random seed to be specified: the Random Number Generation tool in the Analysis ToolPak and the Rnd() function in Visual Basic for Applications (VBA).
Before we dive into these last two methods, it’s worth walking through the evolution of random number generation in Excel as it’s been a tortuous (indeed, some might say torturous) route getting to where we are at the time of writing.
A brief history of RAND()
Prior to Excel 2003, the RAND() function used a linear congruential generator (LCG) to generate pseudorandom numbers between 0 and 1 (with an initial X value of 0.5):
Xn+1 = (9821 * Xn + 0.211327) % 1
Barreto and Howland characterised the randomness of the pre-2003 Excel RAND() function in their book on Monte Carlo simulation in Excel using a “trapping” technique in which the values generated immediately after a value of between 0.7 and 0.7001 were recorded and plotted over the whole 0–1 range:
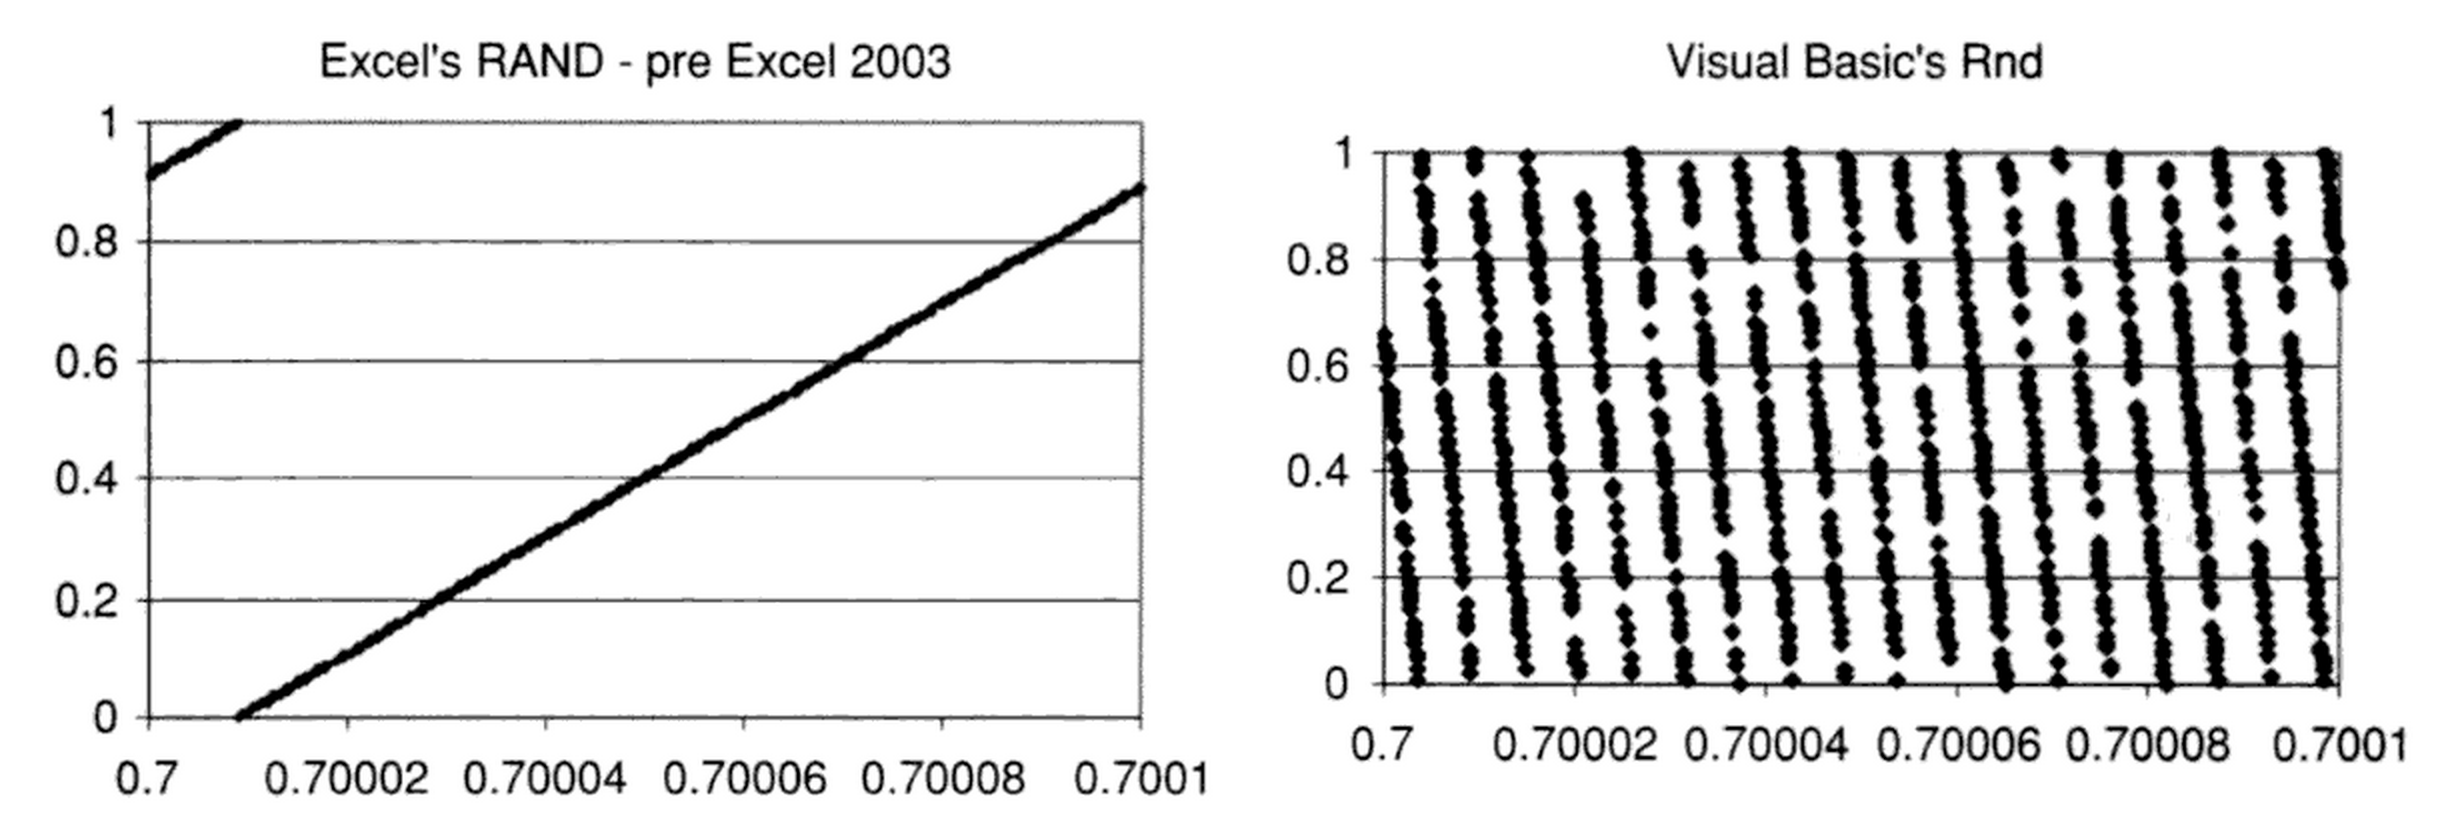
Barreto and Howland Figure 9.2.2
Predictably, this failed the then-current DIEHARD randomness test by George Marsaglia and can trivially be shown to be a relatively poor random number generator (RNG). From Excel 2003 onwards, Microsoft switched RAND() to use an implementation of the Wichmann-Hill algorithm. Wichmann-Hill is also a relatively simple generator, based on a summation of three LCGs:
# includefloat wichmann_hill_random (int *s1, int *s2, int *s3) { float value; *s1 = ((171 * *s1) % 30269); *s2 = ((172 * *s2) % 30307); *s3 = ((170 * *s3) % 30323); value = fmod((float) (*s1) / 30269.0 + (float) (*s2) / 30307.0 + (float) (*s3) / 30323.0, 1.0); return value; }
Unfortunately, the first Wichmann-Hill implementation in Excel was found to be incorrect as it would eventually generate negative numbers (an impossibility according to the 1982 Wichmann-Hill paper). A 2004 bug fix was intended to fix the problem. However, McCullough subsequently used “Zeisel recursion” (so named after a 1986 publication by Zeisel, in which Chinese Remainder Theorem was employed to rewrite the Wichmann-Hill RNG as a single LCG) to demonstrate that the updated generator was still not consistent with the Wichmann-Hill RNG as published. Wichmann-Hill should have a periodicity of 6.95 × 10¹² (not the 2.78 × 10¹³ claimed in the original paper) but, as McCullough and Heiser note, the actual periodicity of the Excel implementation is unknown.
While even the incorrect Excel implementation of Wichmann-Hill passed the DIEHARD test, it failed some aspects of all three of L’Ecuyer and Simard’s (PDF) TESTU01 test suites (SmallCrush, Crush, and BigCrush) which were designed to supersede DIEHARD. Specifically, L’Ecuyer and Simard noted that Wichmann-Hill failed 2, 12 and 22 of the SmallCrush, Crush, and BigCrush test suites, respectively.
If the original RAND() documentation is to be believed, the Wichmann-Hill generator is still in use as of Excel 2010, which is listed in the “Applies to” section. However, the Office 2010 documentation notes that the “RAND function now uses a new random number algorithm” and Guy Mélard reports that there is “semi-official” confirmation that Excel 2010 and later in fact use the Mersenne Twister algorithm to power RAND().
The Mersenne Twister has a period length of 219937 − 1, passes the full DIEHARD test suite, all of the SmallCrush tests and all but 2 each of the Crush and BigCrush tests, according to L’Ecuyer and Simard. While many improvements have been made to RNGs since the publication of the Mersenne Twister (even within the same class of generator), using the Mersenne Twister at least brings Excel to parity with many modern programming environments, including the default RNGs in SPSS and R.
However, the exact implementation details of RAND() and RANDBETWEEN() are immaterial for applications requiring reproducible randomness as the functions cannot be seeded. Seeded randomness can only be achieved using one of the two aforementioned approaches: the Random Number Generation tool in the Analysis ToolPak or VBA. In brief (and highly informal) testing, the Random Number Generation tool in the analysis ToolPak was unbearably slow in generating uniformly distributed random numbers, generating around 36 random numbers per second on a 2.3 GHz Core i7. So that leaves VBA.
Generating seeded random numbers using VBA
Based on Microsoft’s documentation, the Rnd() function in Basic has always been based on a power-of-two modulus LCG. In Microsoft Basic versions prior to Visual Basic 1.0, this took the form:
Xn+1 = (214,013 * Xn + 2,531,011) % 224
From Visual Basic versions 1.0 to 6.0, the operands were updated:
Xn+1 = (1,140,671,485 * Xn + 12,820,163) % 224
Note that the performance of the VB 1.0-6.0 LCG was also characterised by Barreto and Howland in the figure, above. It has a periodicity of 16.106. Interestingly, Microsoft notes that the code used to implement the LCG underpinning
Rnd() could not be implemented in VBA itself due to the use of an unsigned long data type that’s not available in VBA.
Unfortunately there isn’t much Rnd() documentation for VB versions later than 6, but between L’Ecuyer and Simard (who refer to it as a “toy generator”, in part because of its power-of-two modulus) and Mélard, we can surmise that this implementation is still present in VBA in Excel 2010 (and possibly later).
Thankfully, while Rnd() is an extremely unsophisticated RNG, it is at least easy to use and seed. There are two key functions related to random number generation in VBA: Rnd and Randomize. The documentation states that Randomize should be used to initialize the generator, but in practice, the call isn’t necessary and seeding the generator is as simple as calling Rnd() with a single negative integer, as illustrated in the table below. Making repeated calls to Rnd() with the same negative argument yields exactly the same value and subsequent calls without any argument will continue the sequence using the seed from the first call.
If number is |
Rnd generates |
|---|---|
| Less than zero | The same number every time, using number as the seed. |
| Greater than zero | The next random number in the sequence. |
| Equal to zero | The most recently generated number. |
| Not supplied | The next random number in the sequence. |
If random values are required for use in Excel formulae, techniques such as this can be used to quickly export relatively large arrays of random numbers out to a worksheet for later reference.