Just to give it a spin, I started using Numbers today to record some information on transcription factor binding motifs.
Overall, I have to say the experience is very pleasant. First of all, the good points:
- The ability to just drag PDFs, images, graphs and indeed spreadsheets freely around the canvas is excellent.
- Adding steppers, sliders, checkboxes and menus to cells is made remarkably easy.
- The live display of average, sum, maximum, minimum and the count of selected cells is very convenient.
- The “Sheets” list (like a source list for spreadsheets) is far superior to Excels tabs along the bottom, even showing a collapsable list of the tables and graphs on each sheet:

While this is nice, the highlighting in the sheets list is very odd. In the screenshot, the darkened “Occurrences of mo…” graph is currently selected, but the Table is shown with my default selection colour as its background. I imagine Pierre would have something to say about that. - The new format bar makes trips to the Inspector far less frequent. Which is nice.
However, I also have a few reservations already, including the following:
- Conditional formatting cannot take a “cutoff” value from another cell. For example, in the screenshot below, G2 is invalid. Only a numeric value can be entered when a comparison operator is selected from the menu.
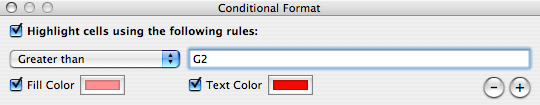
If G2 had been a cell with a slider, one could envisage formatting changing on-the-fly while dragging the slider, which would have been awesome. Sadly it wasn’t to be. - No “freeze panes” option. Anyone who has used Excel knows (or can appreciate) how useful it can be to have your own column or row headers visible at all times when scrolling around. While Numbers ably keeps the row and column headings on screen when scrolling, no option equivalent to Excel’s Freeze panes seems to be available. This makes it a real pain to keep track of which column or row is which in a large spreadsheet.
- Fairly limited graphing. Coming from a scientific background, I’d really like to see the graphs supporting error bars and some linear and polynomial regression (ordinary least squares at the very minimum).
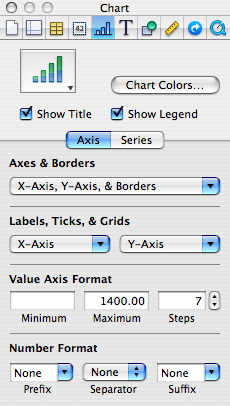
When compared with Excel, Numbers’s graphing options look decidedly sparse.
So overall, I’d say it’s a really nice 1.0 release and I think it hits the target market (“Spreadsheets the Mac way”) extremely well. While the addition of linear and polynomial regression is probably a slight frivolity for the users Apple has in mind (just use R!), I’d say that “freeze panes” is really essential for any spreadsheet package and cell references in conditional formatting would just be a great option to have.
I might post more if I come across any more nifty features or major shortcomings…